



High affinity is often a priority when selecting reagents, but does it guarantee better assay performance? Discover why binding kinetics and matrix selectivity matter when developing custom reagents for challenging targets.
When starting an assay development project, scientists routinely screen a panel of off-the-shelf reagents. For established targets, commercially available tools that fit the assay format are usually accepted. But as biopharma pipelines shift towards novel targets with limited reagent infrastructure, the gap between what programmes need to measure and what available reagents can deliver is widening, leaving teams facing inadequate sensitivity or severe matrix interference.
When scientists turn to custom development, high target affinity often tops the shopping list. Yet, treating high affinity as the primary specification for custom reagents can lead assay development astray. While in vitro selection can reach affinities beyond those typically achieved through standard in vivo immunisation, affinity alone is not the best predictor of how a reagent will perform in the final assay environment.
The affinity ceiling of the immune response
Antibodies raised in vivo can be subject to an immune response affinity ceiling of approximately 100 pM.1 Beyond this, in vitro affinity maturation can engineer improvements, but this can involve a trade-off in specificity or developability.2 Reagents discovered entirely in vitro avoid this limitation and can be engineered from the outset for optimal assay kinetics.3
Optimers are short synthetic oligonucleotides that fold into a defined three-dimensional shape and bind a specific target. Because the Optimer discovery process is entirely in vitro, it does not rely on the immune system.4 This allows the discovery conditions to be chosen rather than inherited and avoids the affinity limitations associated with the immune response. With full affinity profiling during development, the right kinetic parameters for each candidate can be selected to optimise assay performance.
Optimers are not intended to replace well-characterised commercial antibodies where off-the-shelf panels already work. Instead, they earn their place where no commercial candidate exists, where available panels suffer from matrix cross-reactivity, or where formats call for defined-site labelling, or a smaller molecular weight.
Benchmarking three Optimer discovery campaigns
As part of Optimer discovery, we characterise the top hits from next-generation sequencing for affinity, selectivity, stability and function. Affinity is the first of our screens, and the table below sets three recent Optimer discovery campaigns against the commercial antibody or aptamer each customer was already using.
| Target | Benchmark (KD) | Optimer hits screened | Hits beating benchmark | Highest affinity Optimer (KD) | Kon for highest affinity Optimer | Koff for highest affinity Optimer | Top-hit improvement |
|---|---|---|---|---|---|---|---|
|
Lipoprotein lipase |
Antibody (190 pM) |
39 |
16 (41%) |
1.3 pM |
6.8 × 10⁴ M⁻¹ s⁻¹
|
9.1 × 10⁻⁸ s⁻¹ |
142x |
|
Cathepsin G |
Aptamer (2 µM) |
7 |
7 (100%) |
26 nM |
3.2 × 10⁵ M⁻¹ s⁻¹
|
8.3 × 10⁻³ s⁻¹
|
77x |
|
gp120 |
Antibody (30 nM) |
25 |
20 (80%) |
9 nM |
1.39 × 10⁵ M⁻¹ s⁻¹
|
1.3× 10⁻³ s-1 |
3.2x |
While all three campaigns produced hits with higher affinity than the customer’s existing reagent, success in each final application depended on a combination of kinetics and matrix selectivity rather than affinity alone.
Where affinity stops predicting performance
Higher affinity lets an assay use less reagent, which can reduce nonspecific background and lower the limit of detection (LOD) for low-abundance biomarkers. But increasing affinity isn’t the only route to a lower LOD, and it is rarely the easiest. LOD depends on the signal-to-noise ratio, so reducing background noise can improve detection sensitivity without necessarily increasing binding affinity.5
The affinity measurement, KD, compresses association and dissociation rates into one number, and assay performance often depends more on one rate than the other.
An on-rate shows how fast the reagent binds to the target, but an off-rate determines how much complex remains to be counted at readout. High affinity is often associated with a slower off-rate, which helps maintain the reagent-target complex during repeated wash steps. Dinh et al. measured rate constants for seven reagents spanning four orders of magnitude in KD and found that assay signal correlated inversely with the off-rate (koff), whereas the on-rate (kon) showed no correlation.6
How slow an off-rate is worth having depends on the format. In assays that rely on reaching equilibrium within an assay incubation time, Koff < 10-4 s-1 offers no advantage, as the complex half-life of approximately two hours exceeds incubation times.1 In contrast, for affinity purification, the complex has to survive repeated wash steps and column incubations, so a slower off-rate than the assay threshold is an advantage.
Underlying these considerations is selectivity, which affinity alone does not capture. Reagent selectivity is governed by the ratio of affinity for the target to affinity for other molecules in the sample. In complex matrices like feedstock or blood, off-target molecules can outnumber the target by many orders of magnitude.
For example, in blood, albumin is present at approximately 5 mM and so will outnumber a 1 nM target by 5,000,000:1. Even with 50-million-fold weaker albumin binding, the reagent’s KD for the target must be below 9 nM to keep off-target error below 10 percent.5 Each affinity threshold is specific to the reagent and assay environment, but it illustrates a general point that the affinity a reagent needs is established by its selectivity. Reagent performance depends on engineering affinity for the target and discrimination against everything else together.
Engineering selectivity during discovery
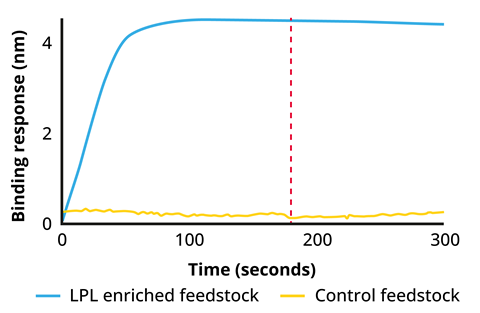
The LPL campaign shows why affinity alone often isn’t enough to deliver a functional reagent. The requirement was to clear residual LPL, a host cell protein present at trace levels in a biologic-dominated feedstock, to meet residual host cell protein specifications. To ensure selectivity, we built this critical requirement into the discovery process rather than relying on screening for the desired profile after the fact. We performed discovery in the sample matrix the process would use, with counter-selection against standard feedstock lacking the biologic, so we discarded sequences that bound any matrix components.
Rather than taking the highest-affinity hit forward, we chose a lead candidate with an affinity of 33 pM that combined the desired selectivity and slow off-rate.
What to ask of a reagent
When off-the-shelf reagent panels fail for a novel target, turning to custom development is often the only path forward. But success requires changing what you put on the shopping list.
High target affinity remains a natural first question to ask of a custom reagent. However, affinity alone cannot predict how that reagent will perform in the final assay environment. This depends on an off-rate suited to the assay format and on discrimination against complex matrix components and off-target molecules to ensure they don’t swamp the measurement, both of which can be difficult to address after a reagent is selected.
For targets with no off-the-shelf answer, high affinity shouldn’t be the sole specification. By engineering matrix selectivity and format-matched kinetics into custom discovery from the start, custom reagent development becomes an active part of assay design to set up programmes for success.
References
- Gorris HH, Soukka T. Anal Chem. 2022;94(16):6073–6083.
- Makowski EK, et al. Nat Commun. 2022;13:3788.
- Aptamer Group. Optimer® platform: custom development workflow. https://aptamergroup.com/optimer-binders/our-workflow/
- Aptamer Group. What is an aptamer? https://aptamergroup.com/optimer-binders/what-is-an-aptamer/
- Wilson BD, Soh HT. Trends Biochem Sci. 2020;45(8):639–649.
- Dinh TL, et al. Anal Chem. 2016;88(23):11335–11339.










No comments yet