High-throughput calcium flux assays: luminescent versus fluorescent readout
Posted: 20 September 2016 | Christophe Thierry (Galapagos NV), Jan Van der Schueren (Galapagos NV), Jans Mia (Galapagos NV), Nicolas Houvenaghel (Galapagos NV) | No comments yet
In vitro high-throughput cellular target-based assays are commonly used for hit identification targeting G-protein coupled receptors (GPCR). Agonist and antagonist identification of GPCRs often relies on the screening of large collections of chemicals using miniaturised in vitro cell-based functional assays. In the panel of assays, calcium mobilisation measured by aequorin oxidation technology has gained increased interest as easily enabling miniaturisation, while reducing readout background and compound interference…

Here, we have developed an aequorin-based calcium mobilisation assay and screened a compound library of 66,000 diverse molecules. Hit confirmation and counter-screen assays were performed using fluorescent dye and aequorin technologies. The implementation of two different technologies allowed the identification of potential hits interfering with the readout. Lack of activity of these compounds on the receptor of interest was confirmed by a biochemical radioactive based assay (GTPγS). Appropriate counter-screen and orthogonal assays are required to exclude such false positive hits for any high-throughput screening (HTS) campaign.
Introduction
GPCRs are popular targets for biotech and pharmaceutical companies working to identify new drugs1 . They are involved in many cell-to-cell interactions and diverse disease types. The majority of these membrane receptors and the major downstream pathways involved are relatively well described in literature. A large diversity of ligands ranging from photons, ions and taste molecules to small molecules, cytokines and peptides, are known to bind to and activate GPCRs.
GPCRs are associated with different classes of G proteins. The choice of an assay depends on the expected throughput, but is also determined by the G protein coupled to the GPCR. The assay technologies most commonly used at Galapagos NV to monitor GPCR modulation are cAMP, CRE reporter, NFAT reporter and calcium flux assays with fluorescent or luminescent readout, depending of the G protein coupling.
Upon stimulation of certain types of G proteins (mainly Gi and Gq-coupled receptors), the intracellular calcium plays a central role with an emphasis on converting endogenous and exogenous signals to cellular responses. This is the case for our GPCR of interest, GPCR-1. Three types of readout were used during this HTS campaign: two cellular assays (a luminescent aequorin calcium [Ca2+] flux and a fluorescent dye Ca2+ flux) and a GTPγS.
The principal of the luminescent aequorin assay is based on the conversion of apo-aequorin to aequorin with high calcium affinity, thanks to the addition of coelenterazine in the cell suspension. Activation of the GPCR will induce intracellular Ca2+ release which binds to the aequorin. The aequorin oxidases the coelenterazine to coelenteramide, which emits light at 470nm (Figure 1) 2.
For the fluorescent dye-based assay, the GPCR expressing cells are pre-loaded with a fluorescent dye combined with a quencher dye (for example, Fluo-8, Tebu-bio). The fluorescent dye crosses the cell membrane and then binds to the intracellularreleased Ca2+, enhancing the fluorescence intensity of the dye. Upon agonist stimulation, intracellular calcium release will enhance a fluorescence signal. A quencher dye will mask the extracellular calcium present in the medium, thus reducing the background fluorescence (Figure 2) 3,4.
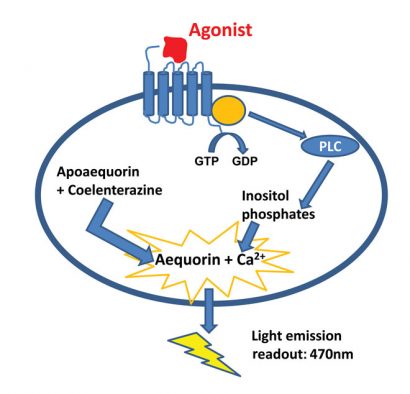
Figure 1: The principle of the aequorin calcium flux assay. Made by Nicolas Houvenaghel
These two techniques have clear advantages: both are functional live cell assays and suitable for the majority of the GPCRs. They can also be miniaturised for use in high-throughput screening and agonist/ antagonist readouts can be subsequently performed5 . However, drawbacks are well referenced in the literature. Interferences of chemical molecules – and to a lesser extent, cells, reagents and plates – are well described for fluorescent dye assays but less so for luminescent aequorin technology5,8. Another feature to take into account is the subtle differences in pharmacology that exist between these two assay types8 . The pros and cons of each technology need to be considered for the assay selection. Last but not least, the identification of false positives and/or false negatives is one of the most important features in HTS6 .
Materials and methods
Aequorin luminescent assay and ATP counter-screen
Cultured Chinese hamster ovary (CHO) cells overexpressing the GPCR of interest (AequoScreen® from Perkin Elmer) were detached, re-suspended in serum-free medium, centrifuged and diluted to obtain 3×10⁵ cells/ml. Cells were loaded with 5μM coelenterazine by overnight (O/N) incubation at room temperature on a rolling system in the dark. Subsequently, 25,000 cells/well were seeded in 50μL in a 384 well microplate. Chemical molecules were pre-diluted (single dose at 10μM final concentration for the HTS or ten-point serial dilutions ranging from 20μM to 1nM for hit confirmation). 10μL of diluted chemical molecules was added to the cells using the FDSS/μCELL and intracellular calcium changes were measured immediately by recording luminescence for a three-minute period (agonist readout).
After an incubation of 15 minutes at 37°C, following the agonist readout, the plates were transferred to the FDSS/μCELL reader. Cells were stimulated with 10μL of EC80 of agonist and intracellular calcium changes were measured immediately by recording luminescence for a three minute period (antagonist readout).
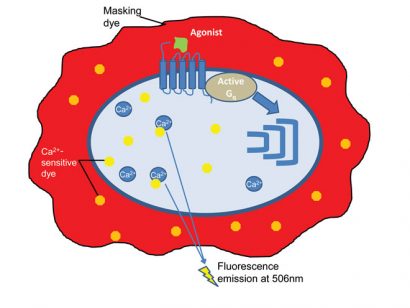
Figure 2: The principle of the fluorescent dye-based calcium flux assay. Made by Nicolas Houvenaghel
Fluorescent-based calcium flux assays
50μL CHO cells stably overexpressing the GPCR of interest were seeded in 384 well sterile microplates at 7,500 cells/well and were incubated O/N at 37°C under 5% CO2. Cells were subsequently washed twice with 25μL/well of serum-free medium. After one hour of starvation at 37°C and 5% CO2, cells were loaded with 25μL of Fluo-8 dye diluted in Hank’s balanced salt solution (HBSS) buffer with 20mM Hepes, complemented with 5mM of probenecid (following the recommendations of the manufacturer) and incubated for one hour at 37°C and 5% CO2.
Chemical molecules were added and the cells triggered with agonist as described above for the aequorin technology. To measure the intracellular calcium changes, the fluorescent signal was recorded for three minutes.
GTPγS assay
This assay allows the level of G protein activation to be determined by measuring the binding of the non-hydrolysable analogue [ 35S]GTPγS to Gα protein subunit upon agonist occupation. Compounds and trigger at EC80 concentration were incubated with a mixture consisting of membranes derived from stable cell line over-expressing the recombinant human targeted GPCR, [35S]GTPγS and scintillation proximity assay (SPA) beads. Reactions were incubated at room temperature for four hours. Plates were centrifuged and read on a TopCount reader immediately after centrifugation.8
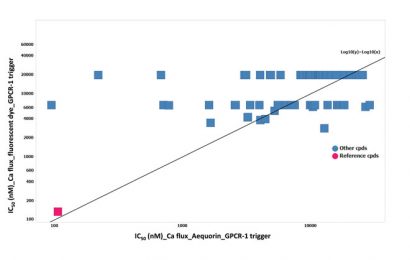
Figure 3: The lack of IC50 (nM) correlation between the aequorin and fluorescent calcium flux data on the possible hit identified
Data analysis
To calculate the percentage of activity, the ratio of maximal signal over background was normalised using control wells with vehicle and the natural agonist. The ratio is determined prior to addition of the trigger for agonist mode and after the injection of the trigger for antagonist mode.
Effective or inhibitory concentration resulting in 50% efficacy or inhibition (EC50 or IC50) was calculated for the serial dilutions using algorithm and equations in a laboratory information management system (LIMS). %PIN was calculated as follows: (100/(average of the positive controls raw – average of the negative controls raw))*(average of the positive controls raw – RAW data of a well). The curve fitting was established as follows: Y=Bottom + ((Top-Bottom)/(1+10^((LogEC50-logX)*HillSlope))).
Results
An HTS campaign of 66,000 chemical molecules was run with the aim of identifying antagonist chemical molecules against GPCR-1. For this screen the aequorin technology was used with a CHO cell-line stably overexpressing the receptor of interest (GPCR-1). From these 66,000 chemical molecules, a cut-off of activity of 25% was used for the agonist activity. None of the molecules activated the GPCR above this cut-off. 820 molecules showed antagonist activity at 10μM, inhibiting the intracellular calcium release by more than 50%.
During the hit confirmation phase, 200 of the 820 possible hits were confirmed as active antagonists for GPCR-1 at 10μM using the same aequorin technology. Hits were considered as confirmed if the percentage of inhibition (%PIN) obtained in the hit confirmation was in the same range (-/+20%) as the %PIN obtained during the HTS campaign. 620 molecules out of 820 were not confirmed.
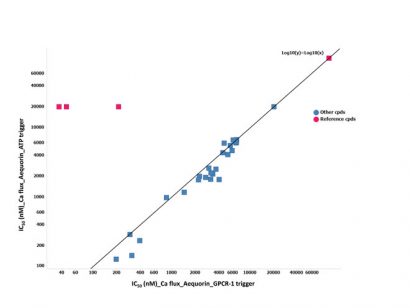
Figure 4: The IC50 (nM) correlation of the cells triggered with ATP versus those triggered with GPCR-1 on the possible hits identified
Subsequently, the IC50 values of the 200 potential hits were determined on GPCR-1 and their selectivity versus a close homologue (GPCR-2) was established using aequorin technology. These were tested in ten-point serial dilution. The hits were considered to be non-selective if they stimulated GPCR-2 by more than 25% (agonist activity), or if they inhibited the intracellular calcium release by more than 50% on GPCR-2. In this test 75 chemical molecules were found to have antagonist activity against GPCR-1 with an IC50 below 5μM without showing any activity against GPCR-2. 125 chemical molecules showed an agonist or an antagonist activity against GPCR-2.
In a next step these 75 chemical molecules were tested in ten-point dose-responses in the fluorescent-based calcium flux assay, using the same stable cell line (CHO over-expressing GPCR-1). Unexpectedly, the most potent hits found in the aequorin assay did not show activity in the fluorescent-based assay, except the reference chemical molecules (Figure 3).
To further investigate the different outcome between aequorin and fluorescent calcium flux assay, another counter-screen was set up. The aim was to use a trigger not related to the target of interest. Adenosine triphosphate (ATP) was chosen because it is a generic trigger stimulating purinergic receptors present in the cellular membranes of most mammalian cells. The 75 possible hits from the HTS were tested in ten-point dilution series in this ATP-triggered aequorin counter-screen. IC50 values determined in counter-screen were found to be equipotent to the one in the GPCR-1 aequorin assay. The reference chemical molecules of GPCR-1 were found to be inactive in the ATP counter-screen assay (Figure 4).
A subset of these hits was tested on other non-target related GPCRs using the fluorescent based technology, and none of these showed agonist or antagonist activity (data not shown). To exclude the possibility that these hits might be non-selective GPCR antagonists, which are able to inhibit both GPCR-1, its close homologue (GPCR-2) and the purinergic receptor, the hits were tested in an orthologue functional GTPγS assay. None of them, tested in ten-point serial dilution, showed inhibition of GTPγS binding on the cell membranes overexpressing GPCR-1 upon addition of the natural agonist (data not shown).
To better understand the discrepancy between the aequorin and the fluorescent data, a scaffold analysis on the chemical structures of these 75 false positive hits was performed. This analysis revealed, among the false positive hit population against GPCR-1, three main chemical groups based on azetidine, imidazopyridines and thieno pyrimidines scaffolds.
Conclusion and discussion 66,000 chemical molecules were tested in an aequorin calcium assay for GPCR-1 resulting in 200 possible antagonists for GPCR-1. After confirmation in the aequorin assay for the target and a close homologue, 75 potential selective hits were retained. Further validation of these potential antagonists in two orthogonal assays – the fluorescent-based calcium flux and the GTPγS assays for GPCR-1 – could not confirm activity. Using an ATP-triggered aequorin assay as a counter-screen could classify all the hits as aspecific.
The molecules tested in the HTS originated from diverse libraries covering a wide variety of scaffolds. Three scaffolds were identified corresponding to 52% of the false positive hit population (azetidine, imidazopyridine and thienopyrimidine). This information might be taken as a potential warning for false positives. However, false positives should nevertheless not be automatically removed simply based on their scaffolds and instead should be subjected to counter-screens in order to form a definite conclusion. Indeed, direct elimination of compounds based on these scaffolds may not be judicious, since it has been shown that such scaffolds could lead to true positive hits10,11.
The choice of technology for an assay plays a pivotal role in identifying non-specific hits. One explanation for the false positive hits obtained in the aequorin assay could be that luminescent quenchers interfere with the readout. Another possibility could be that they are aequorin inhibitors interacting with the coelenterazine binding pocket of the aequorin preventing the coelenterazine from being oxidised (or via another mechanism). For the antagonist aequorin readout this would result in a decrease of luminescence comparable to the inhibition by a real antagonist. Up until now these hypotheses have not been further explored. It might be interesting to investigate whether technology-based counter-screen assays could be set up to discriminate such false positive hits.
The HTS campaign described in this article demonstrates the importance of the use of counter-screen and orthogonal assays using different technologies from the one used for the target-based HTS assay to validate the selected hits. It is critical to implement the counter-screen as early as possible in the screening cascade next to the orthogonal assays.
Finally, readout technologies for GPCRs have improved over recent years. However, new techniques come with their associated challenges, increasing the need for, and the versatility of, technologies used in the counter-screens. Applying a strong and robust screening cascade saves time, money and resources and will increase the quality of the outcome of an HTS campaign.

Nicolas Houvenaghel has a Master’s degree in cellular and molecular engineering, obtained in 2008 at the USTL (France). He completed his Master’s thesis at Janssen Pharmaceutica in Beerse (Belgium). He is a Scientist specialising in in vitro biochemical pharmacology and he is also responsible of the robotic platform park at Galapagos NV.
Related topics
Assays, GPCRs, High-Throughput Screening (HTS)
Related organisations
Galapagos NV, PerkinElmer
Related people
Christophe Thierry, Jans Mia, Nicolas Houvenaghel, Van der Schueren Jan