Assay development for image-based high-content screening
Posted: 15 September 2017 | Horst Flotow, Michael Henkel | No comments yet
Image-based high-content screening (HCS) is a high-throughput screening (HTS) technology that combines automated fluorescence microscopy from microtiter plates with digital image analysis. This effectively allows phenotypic screening with sufficient throughput to interrogate large compound libraries…
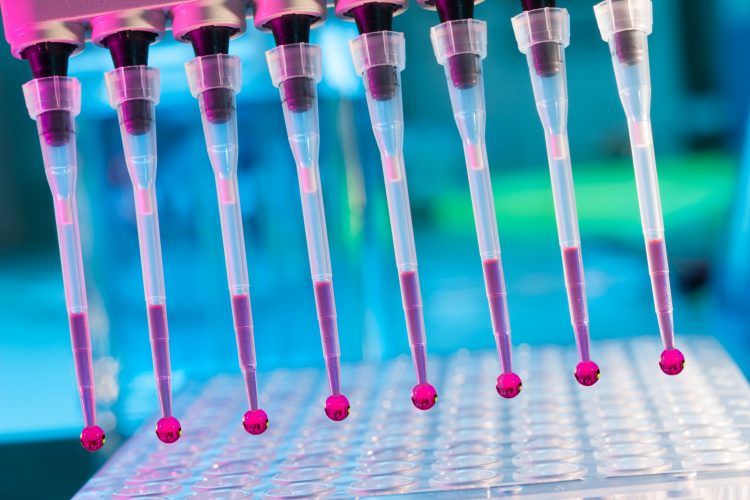
The microscopic images and the data derived from them provide detailed and quantitative phenotypic information about the cells in each well. Therefore, HCS can quantify a number of biological processes and pathways that are intractable to the more `one-dimensional data´ derived from conventional plate readers, for example.
Examples of HCS assays include assays that measure protein translocation, internalisation, externalisation, degradation of target proteins, cellular organelles and substructures, as well as cellular processes like cell migration, cell proliferation and apoptosis. Importantly, phenotypic changes can be measured in live cells (either continuously or at a predetermined endpoint) or in fixed cells (endpoint assays). In addition, several labels can be measured to multiplex the assay and provide additional layers of information.
Obviously, HCS assays are highly complex and can be challenging to design and develop. Their biological relevance, however, has made them an integral part of the early stages of drug discovery.1 The critical importance of HCS assay development is often overlooked in this whole process. Here, we discuss some aspects of assay development that are critical to its successful implementation.
Image information and principle of analysis
Although one could envisage a target agnostic, unbiased phenotypic screen, in practice an image-based assay is usually designed to measure the activity, abundance or location of pathway targets, proteins, and cellular structures of interest. The aim then is to be able to acquire images that can be processed using suitable image analysis software. The image analysis can be a challenge in itself and this topic is more comprehensively covered in a couple of recent publications.2,3 It’s important at the beginning to understand the biology of the system and to be able to acquire images that allow measurement of the phenotypic features under investigation (not some artefacts). We cannot emphasise enough that this should be an integral part of the initial assay design and development.
Assay feasibility and initial optimisation
The first phase of HCS assay development must also demonstrate the feasibility of the desired assay, taking into account the technical and practical limitations of the equipment and other materials on hand. This is often where the vision of an ‘all-singing, all-dancing’ cellular model of tissue function meets the hard (and often pot-holed) reality of what can be achieved in practice. Limitations of the automated microscope (for example, lack of a suitable excitation wavelength laser may sound trivial but can be difficult to overcome in practice); unusual assay plate specification requirements (for example, a special coating to promote cell attachment); unnecessarily complicated experimental conditions; and difficult to obtain or produce materials can all combine to derail your project at this stage.
It’s worth keeping in mind that the main aim of this initial phase of assay development is to demonstrate that images can be obtained that allow a phenotype of interest to be measured. Some of the parameters and variables to consider are described in below.
- Compatibility of proposed/chosen fluorescent markers/dyes with the automated microscope hardware (eg, filters, dichroic mirrors, suitable combinations of fluorophores without overlapping spectra, etc).
- Appropriate staining of targets (eg, specificity and suitability of selected antibodies, special protein tags, organelles, etc) and reference objects (eg, nuclei). This is usually followed by an initial optimisation of the staining process (eg, titration of primary and secondary antibodies, suitable washing steps, blocking of unspecific binding etc).
- Initial setup of the microscope (eg, magnification, illumination intensity (laser power), exposure time, field of view, number of fields per well and their location, z-level, etc).
- Initial image analysis protocol (eg, establish a set of features suitable for automated image analysis, etc).
- Establishment of reference treatments and conditions (eg, treatment with reference compounds, signal to background window, etc)
This initial phase will usually demonstrate the feasibility or otherwise of the proposed assay and is essentially a proof of concept (and constitutes a milestone). It should be noted that the assay that is feasible may look quite different from the all-singing, all-dancing version that was initially envisaged. Nevertheless, this should be a practicable assay that must now be translated and adapted to one that is high-throughput capable.
Assay adaptation to automation
The purpose of HCS assay development is to produce a protocol that is suitable for HTS. In this phase of the assay development, the initially developed (feasible and practicable) assay is put on the track for some refinements that adapt it to (mainly) automated processes.
This is the real world of HTS assays, where the whole assay often has to be further simplified and aspects such as signal stability and robustness of all reagents and compounds over time must be tested and established. This may involve substantial automation of the assay workflow using robotic equipment. The automation may include (some aspects of) the cell culture, staining of samples in microtiter plates, liquid handling, image acquisition and analysis, and so on. The most important objective here is to recapitulate (most) of the features that were established in the initial assay development. For HCS assays, in particular, the automation of the image acquisition, analysis and data handling also need to be established at this stage.
Automated image analysis
Although many HCS assays measure the fluorescent intensity of target(s) of interest and use simple image analysis algorithms to establish hit-picking criteria, this may not be applicable in all assays. Approaches using integrated machine learning can also be employed for the analysis of complex phenotypes.5,6 This (relatively unbiased) approach can be particularly useful where hundreds of features extracted from the initial image analysis need to be distilled down to a handful (or several features combined) to separate the wheat from the chaff and identify hit-selection criteria. This can be achieved using principal component analysis (PCA) or the more recently developed t-distributed stochastic neighbour embedding (t-SNE). Given the complexity of some of the HCS assays, it is often essential to reduce the image analysis to a manageable number of parameters that can be used to specifically and unambiguously select hits.

Generally, the image analysis can be broken up into a couple of steps and should be implemented (automated as much as possible) during the HCS assay adaptation to automation. Some of the suggested steps along with comments are outlined below:
- Load image files and metadata into the analysis software. This sounds trivial but can cause problems if not done properly. It is now mostly performed by software supplied by the instrument manufacturer.
- Segment objects. This generates binary images using intensity thresholds such as those calculated with distribution-based algorithms.
- Calculate object parameters and features. This may include features such as object intensities, form factors, area, etc. It may potentially give hundreds of features and parameters. Identifying the ones that are key to successfully picking hits could require relevant biology domain expertise and/or additional analysis and approaches such as machine learning.
- Select features of interest. This may require filtering (for example, to exclude objects or features that may be artefactual), generating additional parameters by simple calculations (eg, correlation) or combining features and perhaps a classification (eg, by applying thresholds for certain object features).
- Save the processed and analysed data as a table or text file for further processing or upload to a database. This also sounds trivial, but again can cause serious heartache, especially when the data must be shared between different parties.
During assay automation, the statistical parameters that serve as quality control measures will also be established using conformity plates as outlined in the Assay guidance manual.6 The QC parameters may include standard ones like signal to background ratios, Z’ (or robust Z’).7 It should be noted here that the assay at this stage can still exhibit some variability, as the batch sizes (number of plates processed in one run or day) are still fairly small. Importantly, the assay is now ready to be put through its paces in a final set of road tests before the HCS commences.
Robustness testing
The assay development is usually completed with a pilot screen. A selected subset of the library (usually 1,000-2,000 compounds) is tested using the automation protocols established for the assay. Pending the outcome of the pilot screen, HCS can then commence.
It should be noted that the points discussed here are general ones, but the importance of assay development for HCS assays cannot be underestimated. Given the importance of HCS in drug discovery, it is also obvious that it can be enormously rewarding.
About the authors

Horst Flotow is CEO at Hit Discovery Constance (HDC) GmbH
 Michael Henkel is a Senior Scientist at Hit Discovery Constance. He obtained his PhD in Biology from the Technical University Darmstadt, investigating the structure-function relationship of ion channels. Since 2011 he has been working on drug discovery projects, focusing on the development of high-content screening assays and the corresponding image analysis.
References
- Swinney DC. (2013). The Contribution of Mechanistic Understanding to Phenotypic Screening for First-in-Class Medicines. Journal of Biomolecular Screening. 2013;18(10):1186–1192. http://doi.org/10.1177/1087057113501199
- Kriston-Vizi J, Flotow H. Getting the whole picture: high content screening using three-dimensional cellular model systems and whole animal assays. Cytometry. Part a: the Journal of the International Society for Analytical Cytology. 2017;91(2):152-159. http://doi.org/10.1002/cyto.a.22907
- Singh S, Carpenter AE, Genovesio A. Increasing the Content of High-Content Screening: An Overview. Journal of Biomolecular Screening. 2014;19(5):640–650. http://doi.org/10.1177/1087057114528537
- Dao D, Fraser AN, Hung J, Ljosa V, Singh S, Carpenter AE. CellProfiler Analyst: interactive data exploration, analysis and classification of large biological image sets. Bioinformatics. 2016; 32(20): 3210–3212. http://doi.org/10.1093/bioinformatics/btw390
- Uhlmann V, Singh S, Carpenter AE. CP-CHARM: segmentation-free image classification made accessible. BMC Bioinformatics. 2016;17(1):51. http://doi.org/10.1186/s12859-016-0895-y
- Sitta Sittampalam G, Coussens NP, Brimacombe K, et al. Assay Guidance Manual. June 15, 2017. www.ncbi.nlm.nih.gov/books/NBK53196
- Zhang J, Chung T, Oldenburg K. A Simple Statistical Parameter for Use in Evaluation and Validation of High Throughput Screening Assays. Journal of Biomolecular Screening. 1999;4(2):67–73. http://doi.org/10.1177/108705719900400206.
Related topics
Screening
Related people
Horst Flotow, Michael Henkel
