How imaging biomarkers are transforming drug development
Posted: 15 January 2017 | Caleb Roberts, John Waterton, Juliana Maynard, Paul Hockings | No comments yet
Drug developers sometimes think of imaging as an emerging discipline, full of esoteric technologies of marginal relevance to real-world clinical drug development. In fact, the opposite is true: imaging measurements (imaging biomarkers) are used daily in drug development and in personalised medicine. They assess target engagement and receptor occupancy in humans and in animal models. More importantly, they demonstrate the downstream consequences of drug administration to patients: pathway modulation; phenotypic changes to the target cell; off-target effects; modulation of pathophysiology; and disease modification. Indeed, imaging biomarkers were used by the FDA as surrogate endpoints for 30 separate drug approvals between 2010 and 20141.
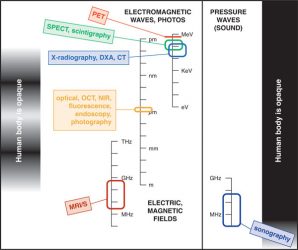
Figure 1: Six imaging modalities most likely to be encountered in clinical drug development.
All these modalities detect a signal from some part of the electromagnetic or acoustic spectrum where signals can penetrate the body. NIR-visible and ultrasound signals penetrate partially. PET (positron emission tomography) and SPECT (single-photon emission computed tomography) rely on detection of gamma rays emitted during or following the decay of a radiotracer. The other four imaging modalities can provide images either without or with an exogenous tracer or contrast agent, depending on the question posed. CT: x-ray computed tomography; DXA: dual-energy x-ray absorptiometry; OCT: optical coherence tomography; NIR: near infrared; MRI/S: magnetic resonance imaging or in-vivo magnetic resonance spectroscopy. Three different scales (frequency, wavelength, energy) are used to characterise different parts of the electromagnetic or acoustic spectrum.
Medicinal chemists and pharmacologists face a bewildering alphabet soup of imaging modalities and techniques – each with different advocates, and each with their own opportunities and limitations. Figure 1 provides a simple overview of the six imaging modalities most likely to be encountered in clinical drug development.
Although imaging studies create pictures, these are only useful to the drug developer when converted to a number or a score that can be used in significance testing or patient inclusion. In this regard, imaging measurements are regarded as biomarkers1,2 and are treated by trial statisticians just like any other biomarker. The FDA and EMA want evidence that a new drug improves how the patients feels, functions, or survives, so almost anything else measured in a clinical trial is considered a biomarker.
Some imaging biomarkers are very familiar to drug developers. Examples include: bone mineral density in osteoporosis3, left ventricular ejection fraction4 in cardiology; objective tumour response5 carotid intima-media thickness6 in atherosclerosis; and the Sharp van der Heijde7 and RAMRIS8 scores used in rheumatoid arthritis. In recent years an even wider array of imaging technologies has been transforming drug development. For example, in personalised healthcare a proprietary MRI technique, the FerriScan transverse relaxation rate R2, was accepted by the FDA as a companion diagnostic9 in the approval of Exjade. Likewise, Endocyte invented a 99mTc SPECT tracer Folcepri, co-developed as a companion diagnostic for Vinfinit.
Imaging tests are increasingly used as pharmacodynamic (PD) and safety biomarkers in early drug development. Dopamine receptor occupancy using [11C]-raclopride PET is familiar to neuroscientists when used10 as a PD biomarker of antipsychotic drug efficacy. In oncology, change in [18F] fluorodeoxyglucose (FDG) standardised uptake value (SUV) in PET is used (Panel 1) as a PD biomarker to measure target and pathway inhibition in the PI3K-AKT-mToR pathway. In rheumatology, change in the transfer constant Ktrans in dynamic contrast-enhanced MRI is used (Panel 2) as a PD biomarker of drug efficacy in synovitis, in addition to its more familiar use in oncology. In toxicology, inhibition of liver organic anion transporters measured using dynamic gadoxetate-enhanced MRI provides a biomarker of risk of drug-induced liver injury (Panel 3).
When drug developers and regulatory authorities make decisions based on imaging biomarker data, they need to trust the validity of the tools they are using. Specialised imaging contract research organisations, usually spun out from academic or industry labs, have been formed to provide imaging biomarkers in animal and clinical settings in a fully validated and compliant way. Validation roadmaps specific to imaging biomarkers have been created11 because, unfortunately, the conventional bioanalytical approaches used to validate biospecimen and biofluid biomarkers are neither practical nor relevant in the imaging setting.
Animal imaging plays a critical role in validation. Animal models are an ideal way to verify that drug-induced changes in the imaging biomarker faithfully reflect drug-induced changes in the underlying disease pathology, as this can be very difficult to show in humans. Since academics, regulators and Pharma have a shared interest in imaging biomarker validation, many public-private partnerships, for example under the Innovative Medicines Initiative, are now running and will further enhance the role of imaging in drug development.
Panel 1: 18F-FDG PET uptake as a pathway-specific pharmacodynamic biomarker for inhibitors targeting the PI3K axis
Juliana Maynard
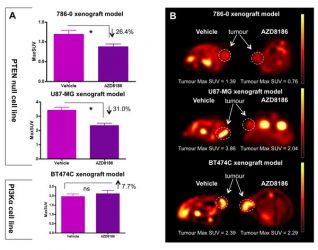
Figure 2: The Use of 18F-FDG PET to screen for PI3K isoform dependency.
A single dose of AZD8186 reduces 18F-FDG uptake in a PTEN null model but not in an α-mutant model, demonstrating its ability as a pathway specific biomarker.
The phosphoinositide 3-kinase (PI3K) signalling pathway plays a key role in the modulation of cell proliferation, cell survival and metabolism. It is frequently altered in human cancer and is a promising therapeutic target.12 The use of pharmacodynamic biomarkers to identify the effectiveness of the therapeutic agent in individual tumours is a key aspect of drug development. 18F-fluorodeoxylgucose positron emission tomography (18F-FDG PET) is often used as a pharmacodynamic biomarker with inhibitors targeting the PI3K axis due to the association of this pathway with glucose metabolism. It can be used in a number of ways, such as to demonstrate a reduction in PI3K pathway output: a significant reduction in 18F-FDG uptake is seen after a single dose of treatment.13,14 In addition, early reductions in 18F-FDG uptake have been demonstrated to be a predictor of change, and therefore 18F-FDG PET can also be used as a predictive biomarker.15
More recently, isoform selective PI3K inhibitors that target specific mutations have been taken into development. 18F-FDG PET can be used to screen for PI3K isoform dependency and guide effective selection of patients for therapy: 18F-FDG PET is able to identify tumours that are specifically dependent on the PI3Kβ isoform.15 Targeting more than one protein within the PI3K pathway may provide greater efficacy than single agents alone. Preclinical modelling will help determine the most effective drug combinations, and pharmacodynamic biomarkers will be critical in helping to determine optimal dosing and mitigate toxicity concerns around many PI3K combination regimens: indeed, 18F-FDG PET has been shown to be a valuable biomarker in understanding the optimum schedule of combination strategies.16
Panel 2: DCE-MRI biomarkers in drug development
Caleb Roberts
Dynamic contrast-enhanced MRI (DCE-MRI) derives quantitative physiologic information from sequential volumetric images rapidly acquired during a bolus injection of gadolinium-based contrast agent. Application of a tracer kinetic model17, as the contrast agent diffuses through the region of interest, provides capillary permeability (Ktrans), interstitial space (ve) and plasma volume (vp) – these imaging biomarkers can be integrated into a clinical trial and monitored over time in a cohort of patients to provide valuable and quantitative insight into tissue microvasculature.
In inflammatory diseases, such as rheumatoid arthritis (RA), the quantitative measurements provided by DCE-MRI enable serial assessment of changes in tissue functional status and provide a biomarker of the extent and magnitude of abnormalities in tissue function. The value of DCE-MRI parameters as early markers of response to treatment was evaluated in RA patients undergoing anti-TNF therapy.18 There was significant decrease in Ktrans after two weeks’ therapy, even though the volume of synovitis change was small in the same timeframe. Similarly, another study in RA patients with biological therapy Ktrans responded 12 and 24 weeks post-therapy.19 In a multicentre clinical trial setting, Ktrans differentiated placebo and fostamatinib from the superior therapy adalimumab.20
In oncology, DCE-MRI has been used extensively to evaluate drug efficacy of monoclonal antibodies and anti-vascular agents. Detecting a vascular response using Ktrans has been the focus of many trials, primarily owing to its sensitivity to changes in vascular permeability within the tumour, a target of anti-angiogenic drugs.21 For example, a decrease in Ktrans of more than 60% from baseline was seen 48 hours post linifanib therapy in a gastric tumour mouse model.22
In early-phase trials, DCE-MRI biomarkers can help inform drug efficacy and dose selection. It can also be useful to help determine the timing of drug use with a combined therapy such as chemotherapy, predict treatment outcome, and to accurately sample the evolution of drug-induced physiological response. An example of this in colorectal cancer showed significant Ktrans knockdown four hours post-bevacizumab treatment that remained sustained until eight days and returned to baseline values by day 12,23 demonstrating not only that early functional changes in the tumour are detectable even when structural changes are not manifest, but also the complexity of the microvascular response of tumours. This information can help inform later phase trial design to define scheduling of imaging relative to drug dosing schemes.
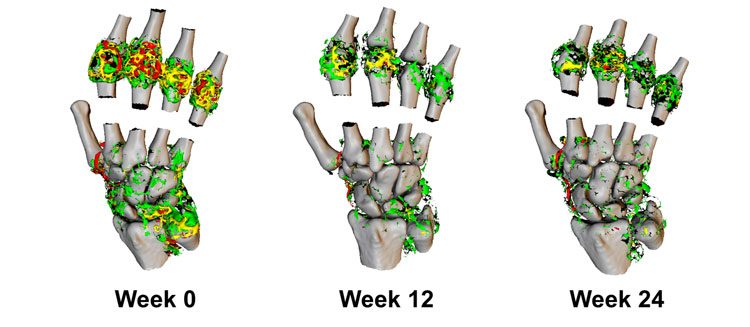
Figure 3: 3D representation of Ktrans in the wrist and metacarpal joints of a RA patient undergoing biological therapy.
Imaging was performed at week 12 and 24 post-therapy. High values of Ktrans (red, > 0.2 min-1) are resolved dramatically through the course of therapy, resulting in predominantly medium (yellow, 0.1-0.2 min-1) to lower Ktrans (green, <0.1 min-1).
Panel 3: Gadoxetate-based MRI biomarkers of risk of drug-induced liver injury
Paul Hockings
Drug-induced liver injury (DILI) has a major impact on the individuals affected and leads to significant additional costs for the pharmaceutical industry from additional clinical trials and delays in reaching the market.24 In vitro approaches and regulatory animal toxicity studies have improved the specificity of DILI predictions, however the sensitivity for detection of false negatives needs to be improved.25,26 Better biomarkers of DILI that are translatable to the clinic may allow quantitative translational safety models to predict toxicity in humans.27
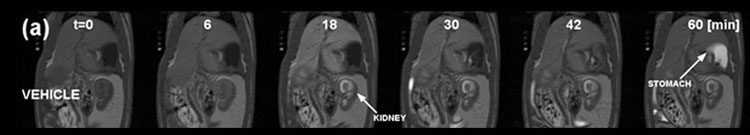
Figure 4: Gadoxetate MRI with kinetic analysis used to describe the effect of an investigational hepatobiliary transporter inhibitor on hepatocellular uptake and excretion in rats.
MR images of a typical vehicle-treated rat pre- and post- injection of gadoxetate (25 μmol/kg). MRI acquisition was started at 0 min, and gadoxetate was injected at 5 min.
Imaging biomarkers can contribute as they can be localised to the liver, detected in real time, and are readily translatable. The clinically-approved contrast agent gadoxetate (Primovist, Bayer) is taken up by hepatocytes and subsequently excreted into bile. Jia et al showed that gadoxetate clearance from the liver is delayed in Mrp2-deficient rats, and that no gadoxetate could be detected in faeces, indicating that transport into bile is blocked.28 Gadoxetate MRI with a kinetic analysis was used to describe the effect of an investigational hepatobiliary transporter inhibitor on hepatocellular uptake and excretion in rats.29 Results showed dose-dependent inhibition of hepatobiliary transporters in vivo. Lenhard et al used gadoxetate MRI to detect hepatobiliary functional changes associated with amiodarone-induced hepatic phospholipidosis.30
These results indicate the potential for gadoxetate MRI to detect drug-induced cholestasis, the blockage of bile flow from the liver, in patients. This blockage can be detected by the accumulation of gadoxetate in the liver with resultant enhancement on the MR image. To qualify this biomarker for use in drug development, further work is being conducted to explore effect size, robustness and timing with a broad range of drugs that alter transporter function and induce adaptation or DILI to understand the link between inhibition of hepatobiliary transporters in preclinical studies and the development of DILI in the clinic. This information will be important for pharmaceutical companies and regulatory agencies when assessing the translatability of preclinical hepatic safety studies.
Biographies
 Professor John Waterton is Professor of Translational Imaging at the University of Manchester, Chief Scientific Officer at Alderley Imaging, and Translational Imaging Specialist at Bioxydyn. He was formerly Chief Scientist at AstraZeneca, and was responsible for preclinical imaging centres in the UK and Sweden with MRI/S, ultrasound, fluorescence imaging, PET, SPECT, CT, and imaging informatics. Prof Waterton is co-author of over 200 peer-reviewed publications and patents in the field of imaging applied to drug discovery and development, and co-leads two IMI projects on imaging biomarker validation.
 Juliana Maynard is Head of Imaging Services MSP at Alderley Imaging. She is an imaging research scientist with experience in a wide range of molecular imaging modalities, including PET, SPECT, CT and ultrasound. Having worked in both the academic and pharmaceutical sectors she is now working to validate the use of imaging biomarkers and demonstrate their potential use as a biomarker to create individualised and targeted treatments in the clinical setting.
 Professor Paul Hockings is Director of Imaging at Antaros Medical and Adjunct Professor at Chalmers University of Technology, Gothenburg, Sweden. Antaros Medical is pioneering new frontiers in innovative MRI/PET imaging techniques, seamless clinical drug development and understanding of human pathophysiology. Paul has 25 years’ experience in the use of medical imaging techniques to develop new medicines.
 Caleb Roberts Head of Imaging Services at Bioxydyn. Caleb is an MRI scientist with over 15 years’ experience using imaging in clinical trials, with particular expertise in DCE-MRI applied in oncology and inflammatory diseases. Caleb currently leads Bioxydyn’s Imaging Services team, delivering high quality advanced MR imaging biomarkers in clinical trials for the pharmaceutical industry.
References
1 Atkinson Jr AJ, et al. Biomarkers and surrogate endpoints: Preferred definitions and conceptual framework. Clinical Pharmacology and Therapeutics. 2001;69: 89-95
2 FDA-NIH Biomarker Working Group (2016). BEST (Biomarkers, EndpointS, and other Tools) Resource. www.ncbi.nlm.nih.gov/books/NBK326791/ (accessed 2016-11-23)
3 Schousboe JT, et al. Position Development Conference on Bone Densitometry. Executive Summary of the 2013 International Society for Clinical Densitometry Position Development Conference on Bone Densitometry. Journal of Clinical Densitometry. 2013;16: 455–466
4 Lang RM, et al. Recommendations for Cardiac Chamber Quantification by Echocardiography in Adults: An Update from the American Society of Echocardiography and the European Association of Cardiovascular Imaging. Journal of the American Society of Echocardiography. 2015;28: 1-39.e14
5 Eisenhauer EA, et al. New response evaluation criteria in solid tumours: Revised RECIST guideline (version 1.1) European Journal of Cancer. 2009;45: 228–247
6 Nezu T, et al. Carotid Intima-Media Thickness for Atherosclerosis. Journal of Atherosclerosis & Thrombosis. 2016;23: 18-31
7 van der Heijde D, et al. Reliability and sensitivity to change of a simplification of the Sharp/van der Heijde radiological assessment in rheumatoid arthritis. Rheumatology. 1999;38:941-947
8 Østergaard M, et al. An introduction to the EULAR–OMERACT rheumatoid arthritis MRI reference image atlas. Annals of the Rheumatic Diseases. 2005;64: i3-i7
9 FerriScan R2-MRI Analysis System Liver Iron Concentration Imaging Companion Diagnostic For Deferasirox www.accessdata.fda.gov/cdrh_docs/reviews/K124065.pdf (accessed 2016-11-25)
10 Nord M, Farde L. Antipsychotic occupancy of dopamine receptors in schizophrenia. CNS Neuroscience & Therapeutics. 2011;17: 97-103
11 O’Connor JPB, et al. Imaging biomarker roadmap for cancer studies. Nature Reviews Clinical Oncology. 2017. ePub http://dx.doi.org/10.1038/nrclinonc.2016.162
12 Markman B, et al. Oncotarget. 2010; 7: 530-543
13 Keen HG et al. Examining changes in [18 F]FDG and [18 F]FLT uptake in U87-MG glioma xenografts as early response biomarkers to treatment with the dual mTOR1/2 inhibitor AZD8055. Mol Imaging Biol. 2014; 3: 421-30
14 Maynard J, et al. 2-Deoxy-2-[18F]fluoro-D-glucose positron emission tomography demonstrates target inhibition with the potential to predict anti-tumour activity following treatment with the AKT inhibitor AZD5363. Mol Imaging Biol. 2013;4: 476-85
15 Maynard J, et al. The use of (18)F-fluorodeoxyglucose positron emission tomography ((18)F-FDG PET) as a pathway-specific biomarker with AZD8186, a PI3Kβ/δ inhibitor. EJNMMI Res. 2016: 220-229
16 Maynard J, et al. The use of 18F-Fluorodeoxyglucose Positron Emission Tomography (18F-FDG PET) as a pathway specific biomarker with AZD8186; a PI3Kβ/δ inhibitor. J Nucl Med. 2015;56S3: 504
17 Tofts PS, et al. Estimating Kinetic Parameters From Dynamic Contrast-Enhanced T1-Weighted MRI of a Diffusable Tracer: Standardized Quantities and Symbols. J. Magn. Reson. Imaging. 1999; 10: 223–232 (1999)
18 Hodgson RJ, et al. MRI of rheumatoid arthritis image quantitation for the assessment of disease activity, progression and response to therapy. Rheumatology. 2008;47:13–21
19 Roberts C, et al. SAT0601 A Novel, Fully 3-Dimensional Dynamic Contrast MRI Method in the Hand Reveals Details of Synovial Inflammation and Provides a Sensitive Measure of Change. Ann. Rheum. Dis. 2015;74S2: 879
20 Waterton JC, et al. Repeatability and response to therapy of dynamic contrast-enhanced magnetic resonance imaging biomarkers in rheumatoid arthritis in a large multicentre trial setting. Eur. Radiol. 2017. http://dx.doi.org/10.1007/s00330-017-4736-9
21 O’Connor JPB, et al. Dynamic contrast-enhanced MRI in clinical trials of antivascular therapies. Nature Reviews Clinical Oncology 2012;9: 167-177
22 Jiang F, et al. ABT-869, a multitargeted receptor tyrosine kinase inhibitor, reduces tumor microvascularity and improves vascular wall integrity in preclinical tumor models. J. Pharmacol. Exp. Ther. 2011;338: 134-142.
23 O’Connor JPB, et al. Quantifying antivascular effects of monoclonal antibodies to vascular endothelial growth factor: insights from imaging. Clin. Cancer Res. 2009;15: 6674-6682
24 Watkins PB, et al. (2011). Drug safety sciences and the bottleneck in drug development. Clin. Pharmacol. Ther. 2011;89: 788-790
25 Chen M, et al. Toward predictive models for drug-induced liver injury in humans: are we there yet? Biomark Med. 2014;8: 201-213
26 Olson H, et al. Concordance of the toxicity of pharmaceuticals in humans and in animals. Regul Toxicol Pharmacol. 2000; 32:56-67
27 Woodhead JL, et al. Mechanistic Modeling Reveals the Critical Knowledge Gaps in Bile Acid-Mediated DILI. CPT Pharmacometrics Syst Pharmacol. 2014;3: e123
28 Jia J, et al. (2014) Characterization of the intestinal and hepatic uptake/efflux transport of the magnetic resonance imaging contrast agent gadolinium-ethoxylbenzyl-diethylenetriamine-pentaacetic acid. Invest Radiol. 2014;49: 78-86
29 Ulloa JL, et al. Assessment of gadoxetate DCE-MRI as a biomarker of hepatobiliary transporter inhibition. NMR Biomed. 2013;26:1258-70
30 Lenhard SC, et al. Hepatic Phospholipidosis Is Associated with Altered Hepatobiliary Function as Assessed by Gadoxetate Dynamic Contrast-enhanced Magnetic Resonance Imaging. Toxicol Pathol. 2016;44: 51-60
Related topics
Biomarkers, Drug Development, Imaging
Related organisations
Alderley Imaging Ltd, Antaros Medical AB, Bioxydyn Ltd, University of Manchester
Related people
Caleb Roberts, Juliana Maynard, Paul Hockings