Phenotypic profiling in drug discovery
Posted: 5 June 2019 | Ina Rothenaigner, Kamyar Hadian, Sean Lin | No comments yet
Image-based phenotypic profiling of small molecules has been used for identification and characterisation of small molecules in drug discovery and can provide important insights into their mechanisms of action (MOA). This article discusses the use of phenotypic profiling in drug discovery and how machine-learning algorithms could help improve objectivity, processing throughput, accuracy and MOA prediction of small compounds.
While target-based drug discovery strategies rely on precise knowledge of the targets’ identity and MOA, phenotypic drug discovery (PDD) approaches allow the identification of novel drugs without understanding pathogenesis. Image-based phenotypic screening is a potent high-throughput screening (HTS) strategy for PDD that enables large-scale studies of biological systems using genetic and chemical perturbations. It also facilitates characterisation of small molecule actions through the quantification of morphological changes among cell populations.
However, phenotypic profiling often generates large and highly complex datasets, making it challenging for lead optimisation and target deconvolution. Technological advancements in image acquisition and processing, and the implementation of machine and deep learning for analysing large high-dimensional datasets have made phenotypic profiling a viable tool in studying small molecules in drug discovery. Here, we discuss current workflows and challenges of image-based phenotypic profiling.
Phenotypic profiling in drug discovery
Many drug discovery efforts have focused on target-based screens in which disease modelling and pathway analysis generate candidate proteins, which generally leads to high-throughput biochemical screening. Phenotypic high-content assays are screening systems that focus on the modulation of a disease-linked phenotype and are therefore less biased.1,2 They can identify compounds acting through either unknown targets or unprecedented MOA for known targets.
In contrast to target-based assays, phenotypic screens are physiologically more relevant, since phenotypic studies not only monitor its MOA, but also the toxicity of small compounds. Despite the ability of high-content screening (HCS) to generate and recognise numerous multiple cellular features, many phenotypic imaged-based hit identification screens have been based on few project-specific and predefined readouts.3 In addition, average readout values are used disregarding the variance of cellular responses in a well. Recent advances in automated imaging and image analysis provide new opportunities and have put yet more content in these high-content analyses.
Image-based phenotypic profiling is an HTS strategy for the quantification of phenotypic differences.4 Phenotypic profiling analyses as many features as possible in a single cell in order to select for robust, meaningful features. These functional and morphometric data are extracted to generate an individual cell profile. The advantage of this multiparametric assay is reduced human bias. In addition, the computational analysis ensures objectivity and consistency. Various treatment conditions (chemical or genetic perturbations) can be compared to identify biologically-relevant similarities/clusters in order to group compounds and/or genes into functional pathways.5
Since image-based screening methods generate huge amounts of data, employing suitable data management and analysis software is crucial in order to extract interesting and novel phenotypes. Here, we discuss the steps taken in image processing for phenotypic profiling and gain insight into the application of machine and deep learning for analysis and classification of cellular phenotypes.
Workflow for image-based profiling
Though the assay design for each image-based cell-profiling screen depends on the biological question at hand, certain steps and equipment are required for all cell-profiling screens.6 Image-based screens are usually performed in multi-well plates (eg, 384-well plates). After seeding an appropriate number of cells into each well, they are treated with small molecules, environmental stressors or siRNAs. Following an incubation time, the cells are fixed and stained with multicolour fluorescent probes that label relevant cellular features/compartments. The images are subsequently captured by automated high-content microscopy and passed on to the image-analysis pipeline (Figure 1).
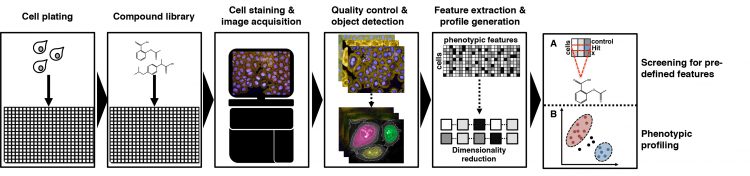
Figure 1: Workflow of image-based small molecule screening experiments. Highthroughput imaging screening experiments usually start with the seeding and incubation of cells in microtiter plates, after which cells are treated with compounds using an automatic liquid handling station. Cells are then fixed, stained and imaged using automated highcontent microscopy. Acquired images undergo quality control, whereupon cellular features are detected and measured using automated analysis software. These extracted cellular features are then either filtered A) for their pre-defined features or B) subjugated further for phenotypic profiling analysis.
Assay reproducibility is crucial when optimising the assay design. Technical variations need to be reduced and variations between reagents and consumables must be avoided. Ideally, positive and negative controls should be added to each multi-well plate to assess assay reproducibility and signal windows. To visualise phenotypes, most HCS uses fluorescent probes to stain specific cellular compartments such as the nucleus, cell membrane, Golgi apparatus, ER or cytoskeleton. A new high-content image-based assay – cell painting – utilises the simultaneous staining of eight broadly relevant cellular components or organelles, enabling multiple morphological perturbations to be monitored in a single cell.7
Image-analysis pipeline
After image acquisition, an automated image analysis workflow is required for feature extraction. Several open-source and commercial bioimaging software solutions exist for morphological feature extraction (Open-source: CellProfiler,8 Advanced CellClassifier,9 PhenoRipper,10 Fiji/ImageJ,11 Commercial: HighContentProfiler (Perkin Elmer)). The workflow is divided into the following tasks that are important to obtain high-quality cell profiling results (Figure 1):
a) Illumination correction – serves to correct each image for spatial illumination heterogeneities introduced by the microscope optics, which can bias intensity-based measurements and impair cellular feature identification.
b) Quality control – aims to identify and remove any problematic images that might impair profiling quality.12 Illumination problems may lead to over-saturated pixels or improper autofocus. Artefacts caused by dust or other particles should be avoided so that particles aren’t falsely identified and classified as a cellular feature during image analysis. Moreover, edge- and gradient-effects in culture plates might influence data analysis and consequently lead to false biological conclusions. It is therefore crucial to place the controls and samples at appropriate places in order to minimise false positives and maximise genuine hits.
c) Segmentation
d) Morphological feature extraction.5
Segmentation and morphological feature extraction entail when objects can be detected by setting intensity thresholds, which delimits objects of interest from the background. Object segmentation often starts with identification of the nucleus, which forms the foundation for identification of secondary regions or objects. Each step needs to be proofread by the user and improved in object detection if necessary. Machine-learning algorithms can also be utilised during object detection to improve feature detection. The classifier is trained to find the desired features in a training dataset until it can accurately generalise towards the dataset while avoiding overfitting. Multi-dimensional features such as fluorescence intensities (eg, mean and maximum intensity), fluorescence distributions, morphology, shape features (eg, area roundness) and texture features (quantify regularity of intensities in images) can be extracted from acquired microscope images. These results are then exported to downstream analysis algorithms, which screen for predefined features (Figure 1A) or generate a feature profile for each cell population allowing creation of phenotypic profiles within cell populations (Figure 1B).
Machine-learning strategies for phenotypic profiling
HCS microscopes can generate huge quantities of image data, making analysis procedures challenging.13 Common image analysis programmes are either unsuitable or require adaptation for phenotypic profiling. However, manual software adaptations are tedious and potentially perturb the concept of an unbiased approach. The implementation of automated analysis methods such as machine learning and deep learning greatly reduce the experimentalists’ workload, while ensuring objectivity and consistency throughout the data analysis. They are also able to identify and assess perturbations between wild type and novel phenotypes.14
In general, machine learning generalises a training dataset in order to predict an unknown dataset accurately.15-17 During the learning phase, a dataset is provided for training purposes to develop or optimise the data analysis algorithm, which in turn attempts to recognise cellular features within the data samples. In the second phase, the fine-tuned algorithm is given new data samples in order to predict properties that have previously been trained during the learning phase.
Supervised machine learning
Machine-learning strategies can be subdivided into supervised and unsupervised machine learning (Figure 2). Supervised machine-learning algorithms are applied for the identification and classification of phenotypic features and rely on representative datasets of sufficient size and quality, whose data points exemplify the predefined classes. The algorithm infers to the set rules and can subsequently discriminate phenotypes between cell populations based on their predefined features.
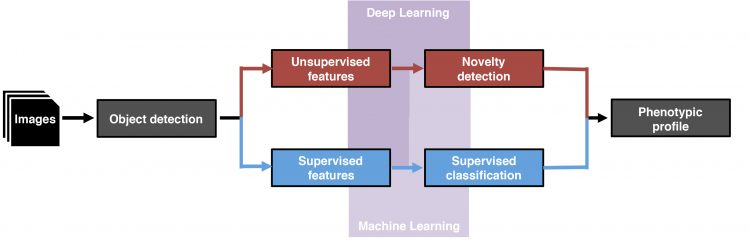
Figure 2: Data analysis workflows for phenotypic profiling. After image acquisition and object detection, supervised features (blue boxes) or unsupervised features (red boxes) are identified and classified either by supervised/unsupervised machine-learning algorithms (pale purple polyomino) or deep-learning algorithms (purple polyomino).
This approach has been successfully utilised for classification of complex phenotypes and generation of training datasets using genetic perturbation, extracellular stimuli and small molecule compounds.18-24 Supervised machine learning is based on subjective decisions for generating the training datasets and feature detection and so proper generation of datasets and correct implementation of the most appropriate machine-learning algorithm is crucial for successful feature extraction and classification.
To evaluate the accuracy of the applied machine-learning algorithm, it is crucial to withhold a portion of the training data to test how well the algorithm has been trained to generalise from the training dataset. In addition, training datasets may need to be re-evaluated and even re-generated, especially if experimental parameters have been changed.17,25-26
Important requirements for a suitable supervised classification algorithm are, therefore, the classification accuracy and versatility in answering diverse cell biological questions without the need to tweak the software. To date, no universal machine-learning algorithm exists that can be applied to all cell biological questions, but a collection of supervised classification algorithms that are based on either linear or nonlinear classifier models are available. Linear classifier models define a decision boundary (discriminating line, plane or hyperplane) between input features to discriminate predefined classes in the dataset. Supervised classification algorithms operating on linear models have been successfully used for the analysis of image-based studies.27-31
Although algorithms based on linear models are able to discriminate clear-cut decision boundaries and are robust against noise within the datasets, they can’t accurately classify more complex distributions of data points such as discriminating changes in cell morphology within cell populations. In contrast, nonlinear classification algorithms are fully capable of dealing with highly complex decision boundaries. These algorithms require more training data to fit and are generally more complex than linear algorithms. They were effectively used inter alia in subcellular localisation, cell cycle arrest phenotypes and cell morphology perturbations.22-23,32-34
Unsupervised machine learning
Although supervised machine learning has been successfully utilised for the classification of complex phenotypes, classification accuracy and data overfitting are obstacles that can be bypassed by unsupervised machine learning.16-17,35 In some biological questions it is not possible to generate a suitable training dataset: if either there is no a priori knowledge of the outcome phenotypes or if the experimenter seeks to identify novel phenotypes.
These limitations could potentially be overcome by implementation of unsupervised machine-learning algorithms that are capable of recognising the above-mentioned phenotypes through clustering or detection of outliers in the data points. Clustering and dimensionality reduction are the main strategies in unsupervised machine learning. Clustering methods, such as hierarchical clustering, κ-means clustering and Gaussian mixture model, aim to maximise the distance between different cluster centres, while simultaneously minimising the distance between the objects within each cluster.15 Hierarchical clustering has been applied to studies on cell perturbations, morphological, gene‑expression and cytological profiling.36-40
Dimensionality reduction is a second method used in unsupervised machine-learning algorithms. It facilitates visual presentation of high-dimensionality datasets by transforming the initial feature space into lower dimensions – either using linear methods such as principle component analysis (PCA) or nonlinear methods such as independent component analysis (ICA) – while retaining as much information from the original high-dimensional feature space.15-16,41 Despite the advantages of unsupervised machine learning, the algorithm’s output is unpredictable and its performance suffers from experimental noise. These limitations in detecting unsupervised phenotypes can be bypassed by incorporating a cell population context or temporal constraints in the machine-learning algorithm, but such knowledge is not always given in every biological application.
Deep learning
Deep-learning algorithms have recently been implemented to address biological classification problems directly from raw image data or implemented immediately after object detection. Like the human brain, deep-learning algorithms use artificial neural networks consisting of multilayered, interconnected nodes and thus learn during multiple sessions through back-propagation.41 Studies have demonstrated successful implementation of deep learning in answering various biological questions, but also as a potent tool in the detection of novel phenotypes (CellCognition Explorer), predicting the biological activity of compounds and as a method for label-free profiling.46-50
Conclusion
Studies have demonstrated that image-based phenotypic profiling is a potent tool for addressing diverse biological questions and for identification and characterisation of small molecules in drug discovery. Every step in phenotypic profiling should be executed attentively to decrease experimental noise and increase accuracy in feature extraction. In order to improve and expand further discoveries using phenotypic profiling, future improvements must focus on developing methods and algorithms that streamline the handling and analysis of generated datasets by implementing more user-friendly machine-learning algorithms. Consequently, deep learning may completely substitute or work in conjunction with manually-curated analysis pipelines, thus improving objectivity, processing throughput, accuracy and MOA prediction of small compounds.
Biographies
 SEAN LIN is a postdoctoral researcher at the Assay Development and Screening Platform, Helmholtz Zentrum München in Munich. He studied Biology at the Heinrich Heine University of Düsseldorf and acquired his PhD at the Max-Planck-Institute of Biochemistry in the field of molecular cell biology. He is responsible for biochemical as well as cell‑based assay development and screening of early drug discovery projects.
 INA ROTHENAIGNER is a postdoc in the Assay Development and Screening Platform at the Helmholtz Zentrum München in Munich. She studied Biology at the Ludwig Maximilians University and gained her PhD at the Helmholtz Zentrum München in the field of virology (HIV). After a postdoc period in the field of zebrafish neurogenetics at the Helmholtz Zentrum and the Institute for Neuroscience at the CNRS, Gif-sur-Yvette in France, she joined the team at the Helmholtz Zentrum München. She has experience in cell-based assays and is responsible for analysis of HTS and high-content screening.
 DR KAMYAR HADIAN is head of the Assay Development and Screening Platform at the Helmholtz Zentrum München in Munich. He has extensive experience in biochemical and phenotypic cell-based assays for HTS and HCS. Prior to this position, he completed a postdoc in cell signalling and a PhD thesis in HIV research. He studied Biology at the Technical University Munich.
References
- Wagner BK, Schreiber SL. (2016). The Power of Sophisticated Phenotypic Screening and Modern Mechanism-of-Action Methods. Cell Chem Biol.23(1), 3-9
- Moffat JG, Vincent F, Lee JA, Eder J, Prunotto M. (2017). Opportunities and challenges in phenotypic drug discovery: an industry perspective. Nat Rev Drug Discov.16(8), 531-543
- Singh S, Carpenter AE, Genovesio A. (2014). Increasing the Content of High-Content Screening: An Overview. J Biomol Screen.19(5), 640-50
- Bougen-Zhukov N, Loh SY, Lee HK, Loo LH. (2017). Large-scale image-based screening and profiling of cellular phenotypes. Cytometry A.91(2), 115-125
- Caicedo JC, Cooper S, Heigwer F, Warchal S, Qiu P, Molnar C, Vasilevich AS, Barry JD, Bansal HS, Kraus O, Wawer M, Paavolainen L, Herrmann MD, Rohban M, Hung J, Hennig H, Concannon J, Smith I, Clemons PA, Singh S, Rees P, Horvath P, Linington RG, Carpenter AE. (2017). Data-analysis strategies for image-based cell profiling. Nat Methods.14(9), 849-863
- Boutros M, Heigwer F, Laufer C. (2015). Microscopy-Based High-Content Screening. Cell.163(6), 1314-1325
- Bray MA, Singh S, Han H, Davis CT, Borgeson B, Hartland C, Kost-Alimova M, Gustafsdottir SM, Gibson CC, Carpenter AE. (2016). Cell Painting, a high-content image-based assay for morphological profiling using multiplexed fluorescent dyes.Nat Protoc.11(9), 1757-1774
- Carpenter AE, Jones TR, Lamprecht MR, Clarke C, Kang IH, Friman O, Guertin DA, Chang JH, Lindquist RA, Moffat J, Golland P, Sabatini DM. (2006). CellProfiler: image analysis software for identifying and quantifying cell phenotypes.Genome Biol. 7(10), R100
- Piccinini F, Balassa T, Szkalisity A, Molnar C, Paavolainen L, Kujala K, Buzas K, Sarazova M, Pietiainen V, Kutay U, Smith K, Horvath P. (2017). Advanced Cell Classifier: User-Friendly Machine-Learning-Based Software for Discovering Phenotypes in High-Content Imaging Data. Cell Syst.4(6), 651-655.
- Rajaram S, Pavie, B., Wu, L. F., and Altschuler,, S. J. (2012). PhenoRipper: software for rapidly profiling microscopy images. Nat Methods. 9, 635–637
- Schindelin J, Arganda-Carreras I, Frise E, Kaynig V, Longair M, Pietzsch, T, Preibisch, S, Rueden, C, Saalfeld, S, Schmid, B, Tinevez, JY, White, DJ, Hartenstein, V, Eliceiri, K, Tomancak, P, Cardona A. (2012). Fiji: an open-source platform for biological-image analysis. Nat Methods.9(7),676-682.
- Bray, MA, Carpenter, AE. (2018). Quality Control for High-Throughput Imaging Experiments Using Machine Learning in Cellprofiler. Methods Mol Biol.1683, 89-112.
- Horvarth, P., Wild, T., Kutay, U., Csucs, G. (2011). Machine learning improves the precision and robustness of high-content screens. J. Biomol. Screen. 16, 1059-1067.
- Danuser, G. (2011). Computer vision in cell biology. Cell. 147, 973-978.
- Bishop, C. M. (2006). Pattern Recognition and Machine Learning. Springer New York.
- Hastie, T., Tibshirani, R., Friedman, J. and Franklin, J. (2005). The Elements of Statistical Learning: Data Mining, Inference and Prediction. Springer New York.
- Sommer, C., and Gerlich, D. W. (2013). Machine learning in cell biology – teaching computers to recognize phenotypes. J. Cell Sci. 126, 5529-5539.
- Perlman, Z. E., Slack, M. D., Feng, Y., Mitchison, T. J., Wu, L. F. and Altschuler, S. J. (2004). Multidimensional drug profiling by automated microscopy. Science. 306, 1194-1198.
- Kittler, R., Putz, G., Pelletier, L., Poser, I., Heninger, A. K., Fischer, S., Konstantinova, I., Habermann, B., Grabner, H., Yaspo, M. L., Himmelbauer, H., Korn, B., Neugebauer, K., Pisabarro, M. T., and Buchholz, F. (2004). An endoribonuclease-prepared siRNA screen in human cells identifies genes essential for cell division. Nature. 432, 1036-1040.
- Doil, C. Mailand, N., Bekker-Jensen, S., Menard, P., Larsen, D. H., Pepperkok, R., Ellenberg, J., Panier, S., Durocher, D., Bartek, J. Lukas, J., and Lukas, C. (2009). RNF168 binds and amplifies ubiquitin conjugates on damaged chromosomes to allow accumulation of repair proteins. Cell. 136(3), 435-446.
- Casterno, A. B., Smurnyy, Y., Torres, A. D., Vokes, M. S., Jones, T. R., Carpenter, A. E., and Eggert, U. S. (2010). Small molecules discovered in a pathway screen target the Rho pathway in cytokinesis.Nat Chem Biol. 6(6), 457-463.
- Neumann, B., Walter, T., Hériché, J. K., Bulkescher, J., Erfle, H., Conrad, C., Rogers, P., Poser, I., Held, M., Liebel, U., Cetin, C., Sieckmann, F., Pau, G., Kabbe, R., Wünsche, A., Satagopam, V., Schmitz, M. H., Chapuis, C., Gerlich, D. W., Schneider, R., Eils, R., Huber, W., Peters, J. M., Hyman, A. A., Durbin, R., Pepperkok, R., and Ellenberg, J. (2010). Phenotypic profiling of the human genome by time-lapse microscopy reveals cell division genes. Nature. 464(7289), 721-727.
- Schmitz, M. H., Held, M., Janssens, V., Hutchins, J. R., Hudecz, O., Ivanova, E., Goris, J., Trinkle-Mulcahy, L., Lamond, A. I., Poser, I., Hyman, A. A., Mechtler, K., Peters, J. M., and Gerlich, D. W. (2010). Live-cell imaging RNAi screen identifies PP2A-B55alpha and importin-beta1 as key mitotic exit regulators in human cells. Nat. Cell Biol. 12(9), 886-893.
- Mercer, J., Snijder, B., Sacher, R., Burkard, C., Bleck, C. K., Stahlberg, H., Pelkmans, L., and Helenius, A. (2012). RNAi screening reveals proteasome- and Cullin3-dependent stages in vaccinia virus infection. Cell Rep. 2(4), 1036-1047.
- Grys, B. T., Lo, D. S., Sahin, N., Kraus, O. Z., Morris, Q., Boone, C., and Andrews, B. J. (2017). Machine learning and computer vision approaches for phenotypic profiling. J. Cell Biol. 216, 65-71.
- Scheeder, C., Heigwer, F. and Boutros, M. (2018). Machine learning and image-based profiling in drug discovery. Curr. Opin. Syst. Biol. 10, 43-52.
- Wang, J., Zhou, X., Bradley, P.L., Chang, S.-F., Perrimon, N., and Wong, S.T.C. (2008). Cellular phenotype recognition for high-content RNA interference genome-wide screening. J. Biomol. Screen. 13, 29–39.
- Horn, T., Sandmann, T., Fischer, B., Axelsson, E., Huber, W., and Boutros, M. (2011). Mapping of signaling networks through synthetic genetic interaction analysis by RNAi. Nat. Methods. 8, 341–346.
- Weber, S., Fernández-Cachón, M.L., Nascimento, J.M., Knauer, S., Offermann, B., Murphy, R.F., Boerries, M., and Busch. H. (2013). Label-free detection of neuronal differentiation in cell populations using high-throughput live-cell imaging of PC12 cells. PLoS One. 8(2), e56690.
- Pardo-Martin, C., Allalou, A., Medina, J., Eimon, P.M., Wählby, C. and Fatih Yanik, M. (2013). High-throughput hyperdimensional vertebrate phenotyping. Nat. Commun. 4, 1467.
- Jolly, A. L., Luan, C.-H., Dusel, B. E. , Dunne, S. F., Winding, M., Dixit, V. J., Robins, C., Saluk, J.L., Logan, D.J., Carpenter, A.E. Sharma, M., Dean, D., Cohen, A. R., and Gefland, V. I. (2016). A genome-wide RNAi screen for microtubule bundle formation and lysosome motility regulation in DrosophilaS2 cells. Cell Reports. 14, 611–620.
- Conrad, C., Erfle, H., Warnat, P., Daigle, N., Lörch, T., Ellenberg, J., Pepperkok, R., Eils, R. (2004). Automatic identification of subcellular phenotypes on human cell arrays. Genome Res. 14(6), 1130-1136.
- Fuchs, F., Pau, G., Kranz, D., Sklyar, O., Budjan, C., Steinbrink, S., Horn, T., Pedal, A., Huber, W., and Boutros, M. (2010). Clustering phenotype populations by genome-wide RNAi and multiparametric imaging. Mol Syst Biol. 6, 370.
- Roosing, S., Hofree, M., Kim, S., Scott, E., Copeland, B., Romani, M., Silhavy, J. L., Rosti, R. O., Schroth, J., Mazza, T., Miccinilli, E., Zaki, M. S., Swoboda, K. J., Milisa-Drautz, J., Dobyns, W. B., Mikati, M. A., İncecik, F., Azam, M., Borgatti, R., Romaniello, R., Boustany, R. M., Clericuzio, C. L., D’Arrigo, S., Strømme, P., Boltshauser, E., Stanzial, F., Mirabelli-Badenier, M., Moroni, I., Bertini, E., Emma, F., Steinlin, M., Hildebrandt, F., Johnson, C. A., Freilinger, M., Vaux, K. K., Gabriel, S. B., Aza-Blanc, P., Heynen-Genel, S., Ideker, T., Dynlacht, B. D., Lee, J. E., Valente, E. M., Kim, J., Gleeson, J. G. (2015). Functional genome-wide siRNA screen identifies KIAA0586 as mutated in Joubert syndrome. Elife. 4, e06602.
- de Ridder, D., de Ridder, J. and Reinders, M. J. (2013). Pattern recognition in bioinformatics. Brief. Bioinform. 14, 633-647.
- Eisen, M. B., Spellman, P. T., Brown, P. O., and Botstein, D. (1998). Cluster analysis and display of genome-wide expression patterns. Proc. Natl. Acad. Sci. USA. 95, 14863–14868.
- Schuldiner, M., Collins, S. R., Thompson, N. J., Denic, V., Bhamidipati, A., Punna, T., Ihmels, J., Andrews, B., Boone, C., Greenblatt, J. F., Weissman J. S., and Krogan, N. J. (2005). Exploration of the Function and organization of the yeast early secretory pathway through an epistatic miniarray profile. Cell 123, 507–519.
- Bakal, C., Aach, J., Church, G., and Perrimon, N. (2007). Quantitative morphological signatures define local signaling networks regulating cell morphology. Science. 316(5832), 1753-1756.
- Gustafsdottir, S. M., Ljosa, V., Sokolnicki, K. L., Anthony Wilson, J., Walpita, D., Kemp, M. M., Petri Seiler, K., Carrel, H. A., Golub, T. R., Schreiber, S. L., Clemons, P. A., Carpenter, A. E., and Shamji, A. F. (2013). Multiplex cytological profiling assay to measure diverse cellular states. PLoS One. 8(12), e80999.
- de Groot, R., Lüthi, J., Lindsay, H., Holtackers, R., and Pelkmans, L. (2018). Largescale image-based profiling of single-cell phenotypes in arrayed CRISPR-Cas9 gene perturbation screens. Mol. Syst. Biol. 14, e8064.
- Domingos, P. (2012). A few useful things to know about machine learning. Commun. ACM. 55, 78-87.
- Devarajan, K. (2008). Nonnegative matrix factorization: an analytical and interpretive tool in computational biology. PLOS Comput. Biol. 4, e1000029.
- Zhong, Q., Busetto, A. G., Fededa, J. P., Buhmann, J. M., and Gerlich, D. W. (2012). Unsupervised modeling of cell morphology dynamics for time-lapse microscopy. Nat. Methods 9, 711-713.
- Failmezger, H., Frohlich, H., and Tresch, A. (2013). Unsupervised automated high throughput phenotyping of RNAi time-lapse movies. BMC Bioinformat. 14, 292.
- Liberali, P., Snijder, B., and Pelkmans, L. (2014). A hierarchical map of regulatory genetic interactions in membrane trafficking. Cell. 157, 1473–1487.
- LeCun, Y., Bengio, Y., and Hinton, G. (2015). Deep Learning. Nature. 521, 436–444.
- Zhou, J., and Troyanskava, O. G. (2015). Predicting effects of noncoding variants with deep learning-based sequence model. Nat. Methods. 12(10), 931-934.
- Pärnamaa T., and Parts, L. (2017). Accurate Classification of Protein Subcellular Localization from High-Throughput Microscopy Images Using Deep Learning. G3 (Bethesda). 7(5), 1385-1392.
- Sommer, C., Hoefler, R., Samwer, M., and Gerlich, D. W. (2017). A deep learning and novelty detection framework for rapid phenotyping in high-content screening. Mol. Biol. Cell. 28, 3428-3436.
- Simm, J., Klambauer, G., Arany, A., Steijaert, M., Wegner, J. K., Gustin, E., Chupakhin, V., Chong, Y. T., Vialard, J., Buijnsters, P., Velter, I., Vapirev, A., Singh, S., Carpenter, A. E., Wuyts, R., Hochreiter, S., Moreau, Y., and Ceulemans, H. (2018).Repurposing high-throughput image assays enables biological activity prediction for drug discovery. Cell Chem. Biol. Cell Chem Biol. 25(5), 611-618.e3.
- O’Duibhir, E., Paris, J., Lawson, H., Sepulveda, C., Shenton, D. D., Carragher, N. O., and Kranc, K. R. Machine learning enables live label-free phenotypic screening in three dimensions. Assay Drug Dev. Technol. 16(1), 51-63.